Mapping Mesh Blocks with TileMill

This quick tutorial will detail how to prepair the ABS Mesh Blocks to be used with MapBox’s TileMill. Beyond scope is how to install postgresql, postgis and TileMill. There is a lot of documentation how to do these tasks.

First, we create a database to import the shapefile and population data into:

Using ‘psql’ or ‘SQL Query’, create a new database:

CREATE DATABASE transport WITH TEMPLATE postgis20 OWNER postgres;
# Query returned successfully with no result in 5527 ms.

It is necessary to first import the Mesh Block spatial file using something like PostGIS Loader.

We then create a table to import the Mesh Block population data:

CREATE TABLE tmp_x (id character varying(11), Dwellings numeric, Persons_Usually_Resident numeric);

And then load the data:

COPY tmp_x FROM '/home/kelvinn/censuscounts_mb_2011_aust_good.csv' DELIMITERS ',' CSV HEADER;

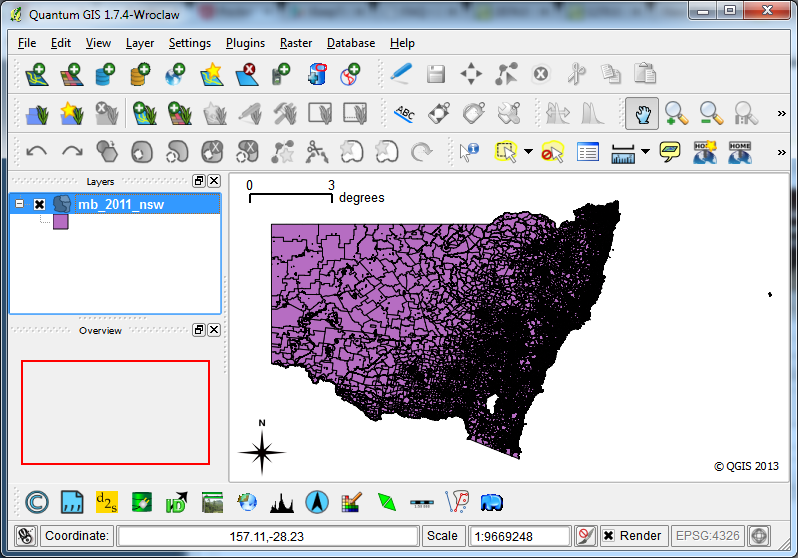
It is possible to import the GIS information and view it in QGIS:

Now that we know the shapefile was imported correctly we can merge the population with spatial data. The following query is used to merge the datasets:

UPDATE mb_2011_nsw
SET    dwellings = tmp_x.dwellings FROM tmp_x
WHERE  mb_2011_nsw.mb_code11 = tmp_x.id;

UPDATE mb_2011_nsw
SET    pop = tmp_x.persons_usually_resident FROM tmp_x
WHERE  mb_2011_nsw.mb_code11 = tmp_x.id;

We can do a rough validation by using this query:

SELECT sum(pop) FROM mb_2011_nsw;

And we get 6916971, which is about right (ABS has the 2011 official NSW population of 7.21 million).

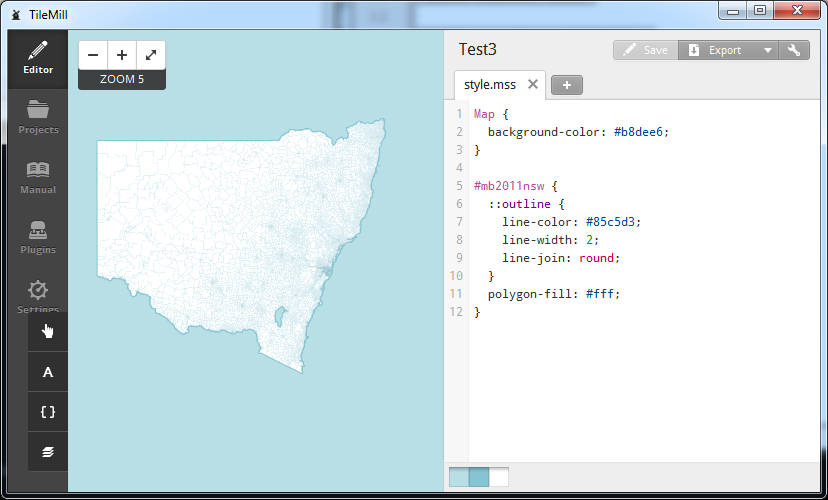
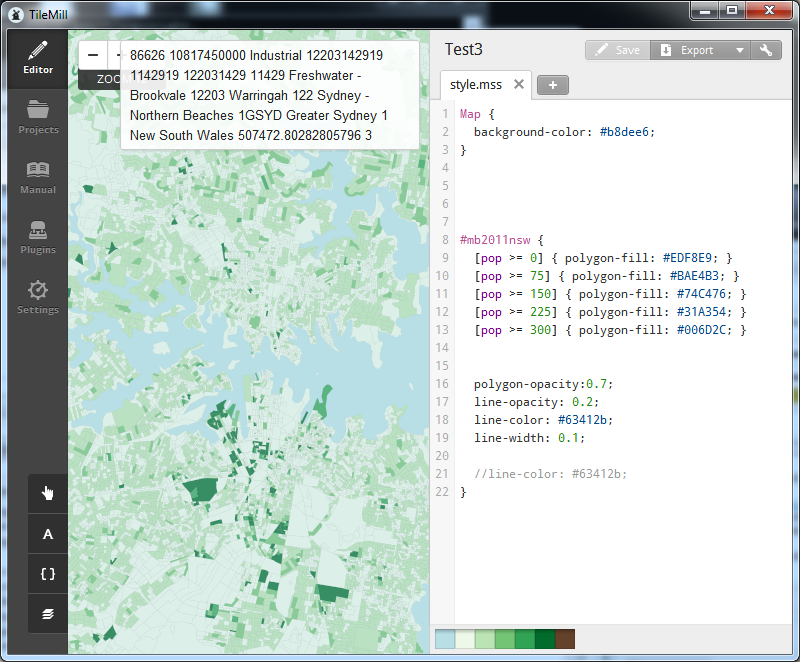
Finally, using TileMill, we can connect to the PostgGIS database and apply some themes to the map.

host=127.0.0.1 user=MyUsername password=MyPassword dbname=transport
(SELECT * from mb_2011_nsw JOIN westmead_health on mb_2011_nsw.mb_code11 = westmead_health.label) as mb

After generating the MBTiles file I pushed it to my little $15/year VPS and used TileStache to serve the tiles and UTFGrids. The TileStache configuration I am using looks something like this:

{
  "cache": {
    "class": "TileStache.Goodies.Caches.LimitedDisk.Cache",
    "kwargs": {
        "path": "/tmp/limited-cache",
        "limit": 16777216
    }
  },
  "layers": 
  {
    "NSWUrbanDensity":
    {
        "provider": {
            "name": "mbtiles",
            "tileset": "/home/user/mbtiles/NSWUrbanDensity.mbtiles"
        }
    },
    "NSWPopDensity":
    {
        "provider": {
            "name": "mbtiles",
            "tileset": "/home/user/mbtiles/NSWPopDensity.mbtiles"
        }
    }
  }
}

Mapping Urban Density in Sydney

EDIT 12-03-2025: I broke the maps when I deleted my AWS account, which I forgot as hosting the mbtiles.

Five years ago I started exploring different mapping technologies by detailing instructions on installing Mapnik and mod_tile. Times have changed significantly in the last five years, and thanks a lot to the products offered by MapBox. After playing with TileMill, MBTiles, Leaflet and UTFGrids, it is great how many annoyances have been fixed by MapBox. I find it enjoyable making maps now, as I no longer need to worry about patching code just to get it to run, or mucking about with oddities in web browser.

Each night this week I have created a new map using Mesh Block spatial data from the Australian Bureau of Statistics (Mesh Blocks are the smallest area used when conducting surveys). I am thankful to live in a country that provides a certain amount of open data, and the ABS should be applauded for the amount of data they provide. They provide spatial data about Mesh Blocks, as well as population counts for this spatial data. It is relatively easy to merge the two and then visualise them using TileMill.

First up - population density of Sydney, i.e. persons reported to be living in each mesh block. Darker red indicates a higher population count.

I find it interesting to see how many people live in certain Mesh Blocks. You will notice that Mesh Blocks with high population levels tend to be nearer public transport - either major roads with frequent bus service, or train stations.

We can look at the urban densities by determining dwellings per hectare, and do this per Mesh Block. The definition I used for urban densities comes from Ann Forsyth in “Measuring Density: Working Definitions for Residential Density and Building Intensity” (pdf). Ann discusses the need to consider net or gross densities, depending on the type of land use. At the Mesh Block level the land use type appears to be singular: Industrial, Parkland, Commercial, Residential, and Transport. Because the land use type was generally singular I have not adjusted to gross/net, but still used Ann’s definitions of certain density bands:

  • Very low density: 11 dw/ha
  • Low density: 11-22 dw/ha
  • Medium density: 23-45 dw/ha
  • High density: 45 dw/ha

“dw/ha” is dwellings per hectare. I decided to map the four density levels, which can be relatively easily achieved using TileMill. See below for an example.

You can zoom in and scroll over any Mesh Block in Sydney to find out more. Additional installation information on how I did this can be found on this special page: Mapping Mesh Block Data.