Sydney Commute Times Mapped Part 2

EDIT 12-03-2025: I accidentially broke the maps when deleting my AWS account, as the mbtiles were hosted there. Oops.

In Sydney Commute Times Mapped Part 1 I took a small step to a bigger goal of mashing together public transport in Sydney, and the Metropolitan Strategy for Sydney to 2031. The question I wanted to answer is this: how aligned is Sydney’s public transport infrastructure and the Metropolitan Strategy’s of a “city of cities”?

I decided to find out.

Thanks to the release of GTFS data by 131500 it is possible to visualise how long it takes via public transport to commute to the nearest “centre”.

Cities and Corridors - Metropolitan Strategy for Sydney to 2031

The Australian Bureau of Statistics collects data based on “mesh blocks”, or roughly an area containing roughly 50 dwellings. Last week I had some fun mapping the mesh blocks, as well as looking at Sydney’s urban densities. These mesh blocks are a good size to look at for calculating commute times.

The simplified process I used was this, for the technical minded:

  1. Calculate the centre of each mesh block
  2. Calculate the commute time via public transport from each block to every “centre” (using 131500’s GTFS and OpenTripPlanner’s Analyst tool)
  3. Import times in a database, calculate lowest commute time to each centre
  4. Visualise in TileMill
  5. Serve tiles in TileStache and visualise with Leaflet

The first map I created was simply to indicate how long it would take to the nearest centre. There appears to be rapidly poorer accessibility on the fringe of Sydney. I was also surprised of what appears to be a belt of higher times between Wetherill Park and all the way to Marrickville. There also appears to be poorer accessibility in parts of Western Sydney. It is worth noting that I offer not guarantee of the integrity of the data in these maps, and I have seen a few spots where the commute times increase significantly in adjacent mesh blocks. This tells me the street data (from OpenStreetMap) might not be connected correctly.

My next map shows what areas are within 30 minutes.

These maps were both created using open data and open source tools, which I find quite neat.

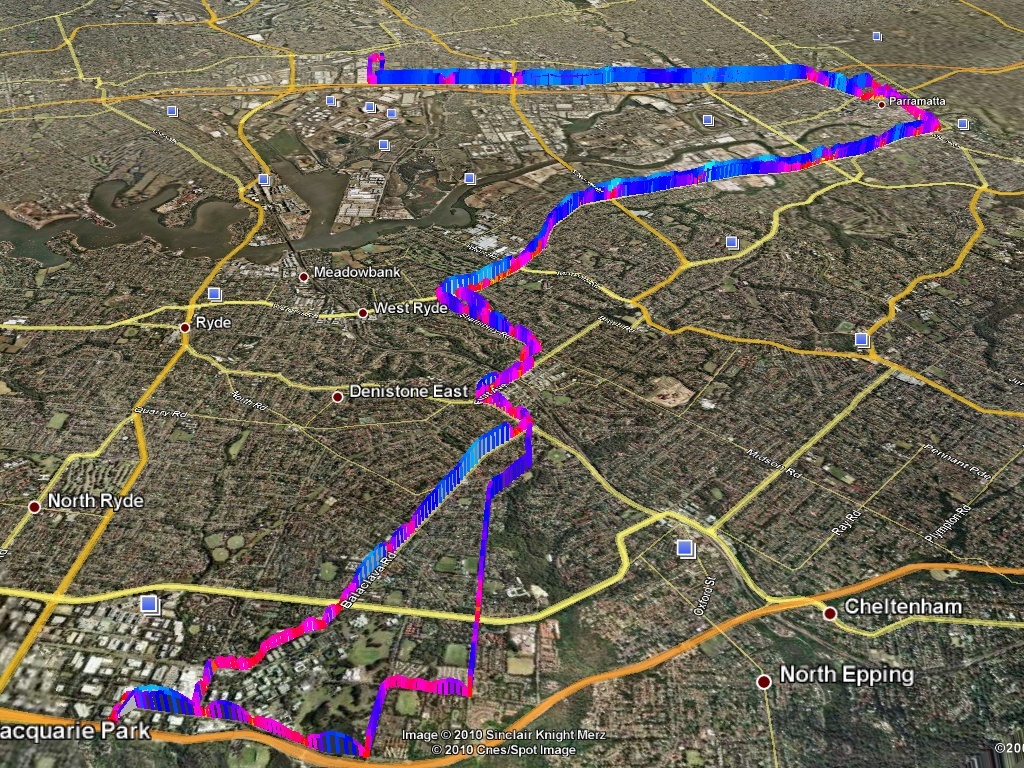
I have been interested in mapping traffic for a number of years, maybe ever since arriving in Sydney. It is sort of a hobby; I find making maps relaxing. My first little map was way back in 2008, where I visualised speed from a GPS unit. A little later I added some colour to the visualisations, and then used this as an excuse to create a little GUI for driving speed. My interest in visualising individual vehicles has decreased recently, as it has now shifted to the mapping wider systems. Have an idea you would like to see mapped? Leave a note in the comments.

Another Baby Step

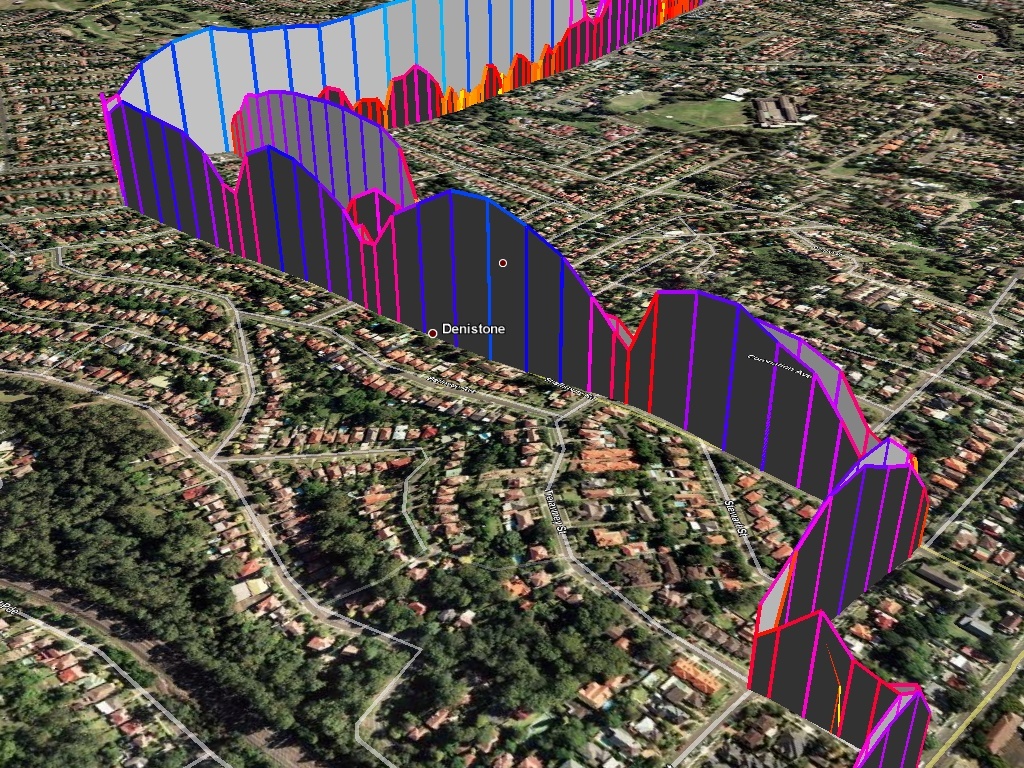
I showed a few of my co-workers my graph and one replied – oh! that’s really cool. (I think only two of my co-workers are actually interested in my geekyness). He then emailed me tonight a .kmz file containing a colorized file of his speed. I looked at the kml and noticed it appeared to be dynamically allocated judging by the top speed. Well, as you could guess, I surely had to modify my code to include colors.

Within an hour I had a semi-working example, and within two hours will easily be done with this blog post. The code might not be perfect, but it first parses the xml and returns the max speed for the trip. Next, it colorizes the speeds based on a scale of 0-255, with 0 being blue for fast and 255 for being yellow, or slow. I was going to study for the CCNA tonight, but it looks like writing Python is just too much fun.

So what, you might ask, are those dips? Good question. They are huge speed bumps (and the tall blue mound in the middle is a really steep hill).

Baby Steps at Graphing Traffic

Status: ✅

You can likely tell that I’ve been having some fun with graphing and mapping recently. I was reading a few articles about GIS and stumbled upon a pretty darn cool project at Webopticon, which included cool pictures. I showed it to a friend thinking they would find it interesting, and then realized: oh! KML has an altitude attribute. That could be interesting.
One of my projects is to create maps of Sydney’s traffic, so I have been experimenting heavily with Mapnik and OSM. I figured I could have some fun and finally parse some gps tracks and display the data.

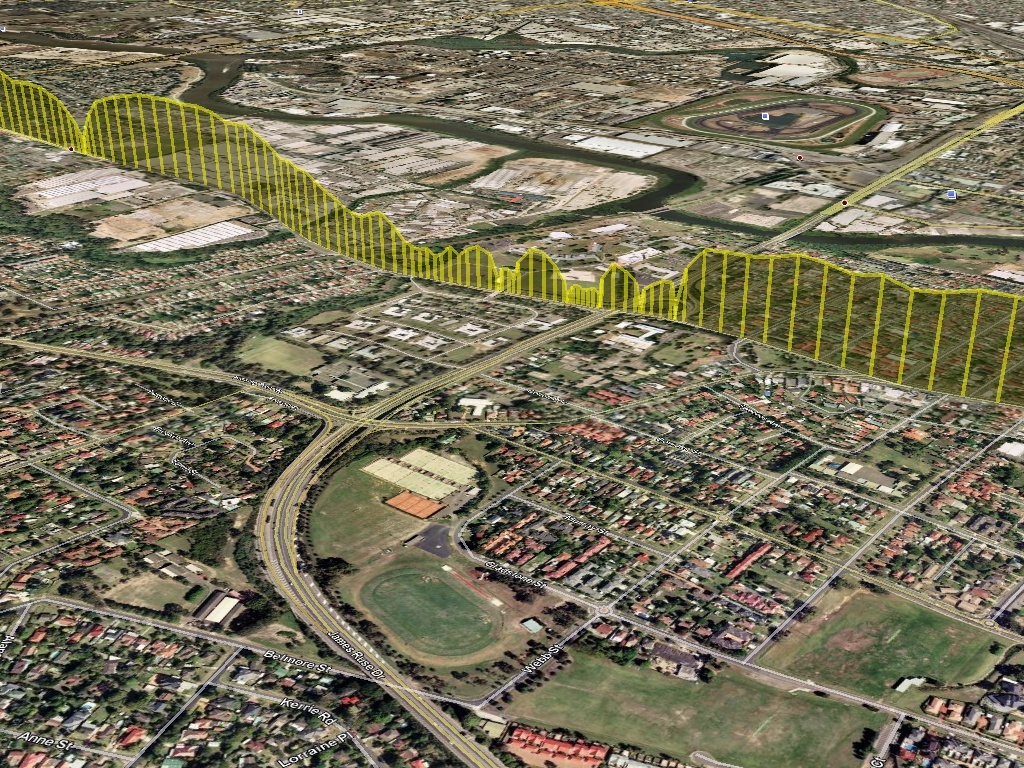
I first started off trying to play around with the KML files my gps logger natively stores. After a while I realized it shouldn’t be this hard to parse the XML, and realized it also stores data in gpx format. I opened up one of the gpx files and immediately saw how much easier it would be to work with. I quickly created a parser for the xml in Python (using the dom method, yet I think I’m going to rewrite it using sax), and then with the aid of an article by Sean Gillies, converted the needed objects into KML. I used the speed attribute (with some magnification) as the altitude, and voila, a pretty picture.
This picture is as Victoria Road crosses James Rouse Drive – a spot that is always congested in the morning.
I’ll likely post some code shortly, I would like to rewrite the parsing section to use something event-driven – hopefully it will be a little faster.

Size of Uncompressed OSM File

I’ve been playing around with OSM a little lately, and have been meaning to construct my own slippy map. At first I wanted to do it on my VPS – but with rather limited storage, and even more limited memory, there just isn’t a way. Three problems exists: the first occurs when trying to use osm2pgsql to import the OSM file into the database. Current records state that this typically uses 650+ MB, something my 512MB VPS just doesn’t have (although I’m writing some code that might make this possible in the future).

The second problem exists with CPU usage. Processes on my VPS don’t really utilize the CPU much, which means renicing the process doesn’t do a thing. The CPU pegs at 100%, as it is supposed to do, except that the VPS auto-kills processes that stay at 100% for any length of time. Luckily somebody wrote a program called “cpulimit” (apt-get install cpulimit) that will cap the CPU usage for a process.

The last problem that I thought about is what if I could uncompress the file. Would that use less memory to stick it in the database? I searched and searched but couldn’t find an answer to how big the actual .osm file is. I ultimately broke down and decided to spend the 50c it would take to get this all done with EC2, and write some scripts to automate it in the future.

However, since I’ve finally uncompressed the .osm, I can tell you that as of about January 1st, 2008, the uncompressed OSM size is 67GB.