Sydney's Education Levels Mapped

I was talking to a friend about what education levels might look like across Sydney, and a friend challenged me to map it.

The map was derived by combining three datasets from the Australian Bureau of Statistics (ABS - a department releasing some great datasets). The first dataset was the spatial data for “SA2” level boundaries, the second the population data for various geographic areas, and the third from the 2011 Census on Non-School Qualification Level of Education (e.g. Certificates, Diplomas, Masters, Doctorates). I aggregated all people with bachelors or higher in an SA2 region, and then divided that number by the total number of people in that region. A different methodology could have been used.

EDIT: I should have paid more attention to mapping education levels. I mapped the percentage of overall population, but should have mapped the percentage of 25 to 34 year olds, as this would have aligned to various government metrics.

Reported education levels differ vastly by region, e.g. “North Sydney - Lavender Bay” (40%) vs. “Bidwell - Hebersham - Emerton” (3%). It is interesting to look at the different urban density levels of the areas, as well as the commute times to the nearest centre.

Without trying to sound too elitist, I was hoping to use this map to guide me where to consider moving (i.e. looking for a well educated, clean area with decent schools and frequent public transport). It was interesting to discover that the SA2 region I currently live in has the second highest percentage in NSW.

Sydney Commute Times Mapped Part 2

EDIT 12-03-2025: I accidentially broke the maps when deleting my AWS account, as the mbtiles were hosted there. Oops.

In Sydney Commute Times Mapped Part 1 I took a small step to a bigger goal of mashing together public transport in Sydney, and the Metropolitan Strategy for Sydney to 2031. The question I wanted to answer is this: how aligned is Sydney’s public transport infrastructure and the Metropolitan Strategy’s of a “city of cities”?

I decided to find out.

Thanks to the release of GTFS data by 131500 it is possible to visualise how long it takes via public transport to commute to the nearest “centre”.

Cities and Corridors - Metropolitan Strategy for Sydney to 2031

The Australian Bureau of Statistics collects data based on “mesh blocks”, or roughly an area containing roughly 50 dwellings. Last week I had some fun mapping the mesh blocks, as well as looking at Sydney’s urban densities. These mesh blocks are a good size to look at for calculating commute times.

The simplified process I used was this, for the technical minded:

  1. Calculate the centre of each mesh block
  2. Calculate the commute time via public transport from each block to every “centre” (using 131500’s GTFS and OpenTripPlanner’s Analyst tool)
  3. Import times in a database, calculate lowest commute time to each centre
  4. Visualise in TileMill
  5. Serve tiles in TileStache and visualise with Leaflet

The first map I created was simply to indicate how long it would take to the nearest centre. There appears to be rapidly poorer accessibility on the fringe of Sydney. I was also surprised of what appears to be a belt of higher times between Wetherill Park and all the way to Marrickville. There also appears to be poorer accessibility in parts of Western Sydney. It is worth noting that I offer not guarantee of the integrity of the data in these maps, and I have seen a few spots where the commute times increase significantly in adjacent mesh blocks. This tells me the street data (from OpenStreetMap) might not be connected correctly.

My next map shows what areas are within 30 minutes.

These maps were both created using open data and open source tools, which I find quite neat.

I have been interested in mapping traffic for a number of years, maybe ever since arriving in Sydney. It is sort of a hobby; I find making maps relaxing. My first little map was way back in 2008, where I visualised speed from a GPS unit. A little later I added some colour to the visualisations, and then used this as an excuse to create a little GUI for driving speed. My interest in visualising individual vehicles has decreased recently, as it has now shifted to the mapping wider systems. Have an idea you would like to see mapped? Leave a note in the comments.

Quantified Self Interview

YS and I were recently interviewed about self-tracking and Quantified Self by one of the major news channels in Australia. I will reflect on the experience after the show has aired, but it was an overall great experience. We have a new respect for filming what may ultimately be just a two minute segment. Depending on how the editing is done it will either provoke the hosts to contemplate the value of a data-centric macroscopic view of the world, or give them lots of fodder.

That said, as you would expect, I had to track my heart rate during the interview - see below. My interpretation is that my heart rate jumped at the start of every questions, and went down as I answered the question. It also dropped when the interview finished. I wish I had a more expensive heart rate monitor (e.g. Zephyr BioHarness or Scanadu) that tracked skin temperature and breathing. My hands felt cold by the end.

.

Coffee, Beer, Wine and Time of Day

One of the things I like Tableau, a piece of software to visualise data, is that it aggregates on dates really well. Below is a spread of beer / wine / coffee over 18 months, but grouped by what hour is fell in. You can see some trends, like I usually consume coffee in the morning, and that I usually drink after 17:00. There are exceptions, of course, like that beer I had at 10AM, and that coffee I had at 1AM.

Some QS Numbers

There is the possibility I will be giving an interview on the Quantified Self “movement”. What follows is a brief summary of QS, the things I track, and some pretty charts.

What is Quantified Self

I suppose it depends on who you talk to. Wikipedia states that it is “a movement to incorporate technology into data acquisition on aspects of a person’s daily life in terms of inputs”, but I side more on the idea that the movement is “a collaboration of users and tool makers who share an interest in self knowledge through self-tracking.” It is at this point that it is probably important to interject that most people are self-trackers: weight, height, reps at the gym, hours worked, and so forth. If you have ever made a goal, you probably tracked how you could reach it. What makes us QS folk a bit different is that we tend to track lots of things, correlate between them, and share our results. So, with this theme, let me share what I track.

What I Track, and How

This is a list of some of the things I track, and the tools I use to do so.

  • Weight / Body Fat / Temperature / Measurements -> scales, callipers, ear thermometer
  • Resting Heart Rate -> oximeter
  • Drinks (wine, beer, coffee – and previously water) -> Android app (bespoke)
  • Drugs and vitamins -> Android app (bespoke)
  • Various conditions (headaches, “colds”, itchiness, nausea, sore throats, “the runs”) -> Android app (bespoke)
  • Finances (family) -> Android app (TOSHL)
  • Start/Stop times of work -> Excel…
  • Mood (Terrible to Great) -> Android app (How Are You Feeling)
  • Indoor air quality (not really QS) -> various sensors
  • Computer activity (Keystrokes / mouse clicks / mouse movement) -> WorkRave
  • Location -> Google Latitude
  • Steps & sleep -> Fitbit
  • Fitness –> Android app (Sports Tracker) and a Zephyr Bluetooth Heart Rate Monitor
  • Health History -> Microsoft HealthVault
  • Photo every day -> Android app (PhotoChron)

You can see that this list seems utterly normal, but still gives me enough to work with to start forming a macroscopic view of life.

A Few Charts

I created these using Tableau, a fabulous piece of software for putting meaning behind numbers. These are not good examples of what the software is capable of, but it is the quickest way for me to visualise them.

I like coffee. It is, in all honesty, a drug. There have been times (I could probably find the date!) when I went from two cups a day to none, and I had withdrawals (headaches and nausea). I track the amount of coffee I consume to remind myself to not get into the habit of having two cups/day for too long. It is also bad for my stomach.

If I chart the days of the week I like to drink coffee over the last 18 months, it turns out I drink the most amount of coffee on Saturday

 I also enjoy an alcoholic drink from time to time, but was told in January to cut back (for my stomach’s sake).

I track both beer and wine consumption. I have managed to cut back on wine, but not so much on beer.

This can be explained because I tend to have beer when I go out with work colleagues or friends, but wine at home. It appears to have been easier to stop drinking with dinner than when out.

For the last two years I have been wearing a FitBit, usually, and using it to “track” my sleep.

It looks like I averaged about 7500 steps/day, yet started walking more in January of this year. Walking more was not a New Year’s Resolution. In May I broke the clip to my FitBit, but a friend was kind enough to give me their’s as a replacement. I should walk more.

I should also sleep more. It appears as though maybe, just maybe, I am starting to sleep more. My average is about 7.5hr/night. This is one area I would like to experiment more with.

I have also started tracking happiness on a simple Terrible -> Great! scale.

This graph shows my average happiness on a weekly basis for the last ~8 months. We could conclude that I’m getting more happy, and was really unhappy around Christmas.

And here we have my happiness levels when grouped by day of the week. We could conclude that I am, on average, the most content on a Sunday. I would like to believe it is just a coincidence that I am most content on a Sunday, and drink the least amount of coffee.

This is the standard deviation of my happiness tracking on a monthly basis. It looks like I am also getting less moody.

And finally, weight. Nothing interesting here. I need to get back down to 77KG, which is a more natural weight for me. I use a normal scale so only record every few months - if I had a wi-fi scale, I would be able to record much more frequently. 

Final Thoughts

In the last ~18 months I have become more happy and less moody, with Sunday being my happiest day, and Monday and Wednesday being my least content. I have put on three KG. I drink the most amount of coffee on Saturday, the least amount on Sunday, and have been able to drink less wine, but keep drinking the same amount of beer.

By looking at this evaluation I know I should probably start to incorporate a lunchtime walk into my daily routine, and stop drinking coffee on one day of the weekend. I should also drink my beer at a slower pace when I’m out, as this will prevent me from buying more than one, or, even harder to resist, friends and colleagues buying it for me.

Finally: I know none of the charts have a title. Read the text.

Sydney Commute Times Mapped Part 1

EDIT 12-03-2025: I accidentially broke the maps when deleting my AWS account, as the mbtiles were hosted there. Oops.

I quite like open data. I like data based on open standards (or mostly open standards) even better. Many transport operators around the world have started releasing their timetable data using (mostly) open standards, e.g. GTFS. One of the nice things about using a standard is that clever people have created tools to work with the timetable data, and those tools can now be used to manipulate timetable data from hundreds of agencies. The magnificent OpenTripPlanner is one such tool, and it works well with 131500’s GTFS data.

New South Wales Planning & Infrastructure have released a draft plan for how they hope to shape Sydney’s growth, which is where they detail the idea of a “city of cities”. I thought it would be interesting to mash these smaller “cities” with 131500’s transport data, and then display a map with the shortest commute to the nearest city. Various cities, I believe including Melbourne, have goals of re-achieving a “20-minute” city, or something similar (i.e. X% of the population can reach X% of the city within X minutes).

This map is the first stage. It only displays the commute time to St Leonards from every Mesh Block in the greater Sydney area. I used the open source tool OpenTripPlanner to computer the commute times, with OpenStreetMaps to support walking distances. The next map I release will probably have all the regional cities, and a similar styled map depicting time to nearest “centre”.

Mapping Urban Density in Sydney

EDIT 12-03-2025: I broke the maps when I deleted my AWS account, which I forgot as hosting the mbtiles.

Five years ago I started exploring different mapping technologies by detailing instructions on installing Mapnik and mod_tile. Times have changed significantly in the last five years, and thanks a lot to the products offered by MapBox. After playing with TileMill, MBTiles, Leaflet and UTFGrids, it is great how many annoyances have been fixed by MapBox. I find it enjoyable making maps now, as I no longer need to worry about patching code just to get it to run, or mucking about with oddities in web browser.

Each night this week I have created a new map using Mesh Block spatial data from the Australian Bureau of Statistics (Mesh Blocks are the smallest area used when conducting surveys). I am thankful to live in a country that provides a certain amount of open data, and the ABS should be applauded for the amount of data they provide. They provide spatial data about Mesh Blocks, as well as population counts for this spatial data. It is relatively easy to merge the two and then visualise them using TileMill.

First up - population density of Sydney, i.e. persons reported to be living in each mesh block. Darker red indicates a higher population count.

I find it interesting to see how many people live in certain Mesh Blocks. You will notice that Mesh Blocks with high population levels tend to be nearer public transport - either major roads with frequent bus service, or train stations.

We can look at the urban densities by determining dwellings per hectare, and do this per Mesh Block. The definition I used for urban densities comes from Ann Forsyth in “Measuring Density: Working Definitions for Residential Density and Building Intensity” (pdf). Ann discusses the need to consider net or gross densities, depending on the type of land use. At the Mesh Block level the land use type appears to be singular: Industrial, Parkland, Commercial, Residential, and Transport. Because the land use type was generally singular I have not adjusted to gross/net, but still used Ann’s definitions of certain density bands:

  • Very low density: 11 dw/ha
  • Low density: 11-22 dw/ha
  • Medium density: 23-45 dw/ha
  • High density: 45 dw/ha

“dw/ha” is dwellings per hectare. I decided to map the four density levels, which can be relatively easily achieved using TileMill. See below for an example.

You can zoom in and scroll over any Mesh Block in Sydney to find out more. Additional installation information on how I did this can be found on this special page: Mapping Mesh Block Data.

Hiking the W Circuit (Torres del Paine)

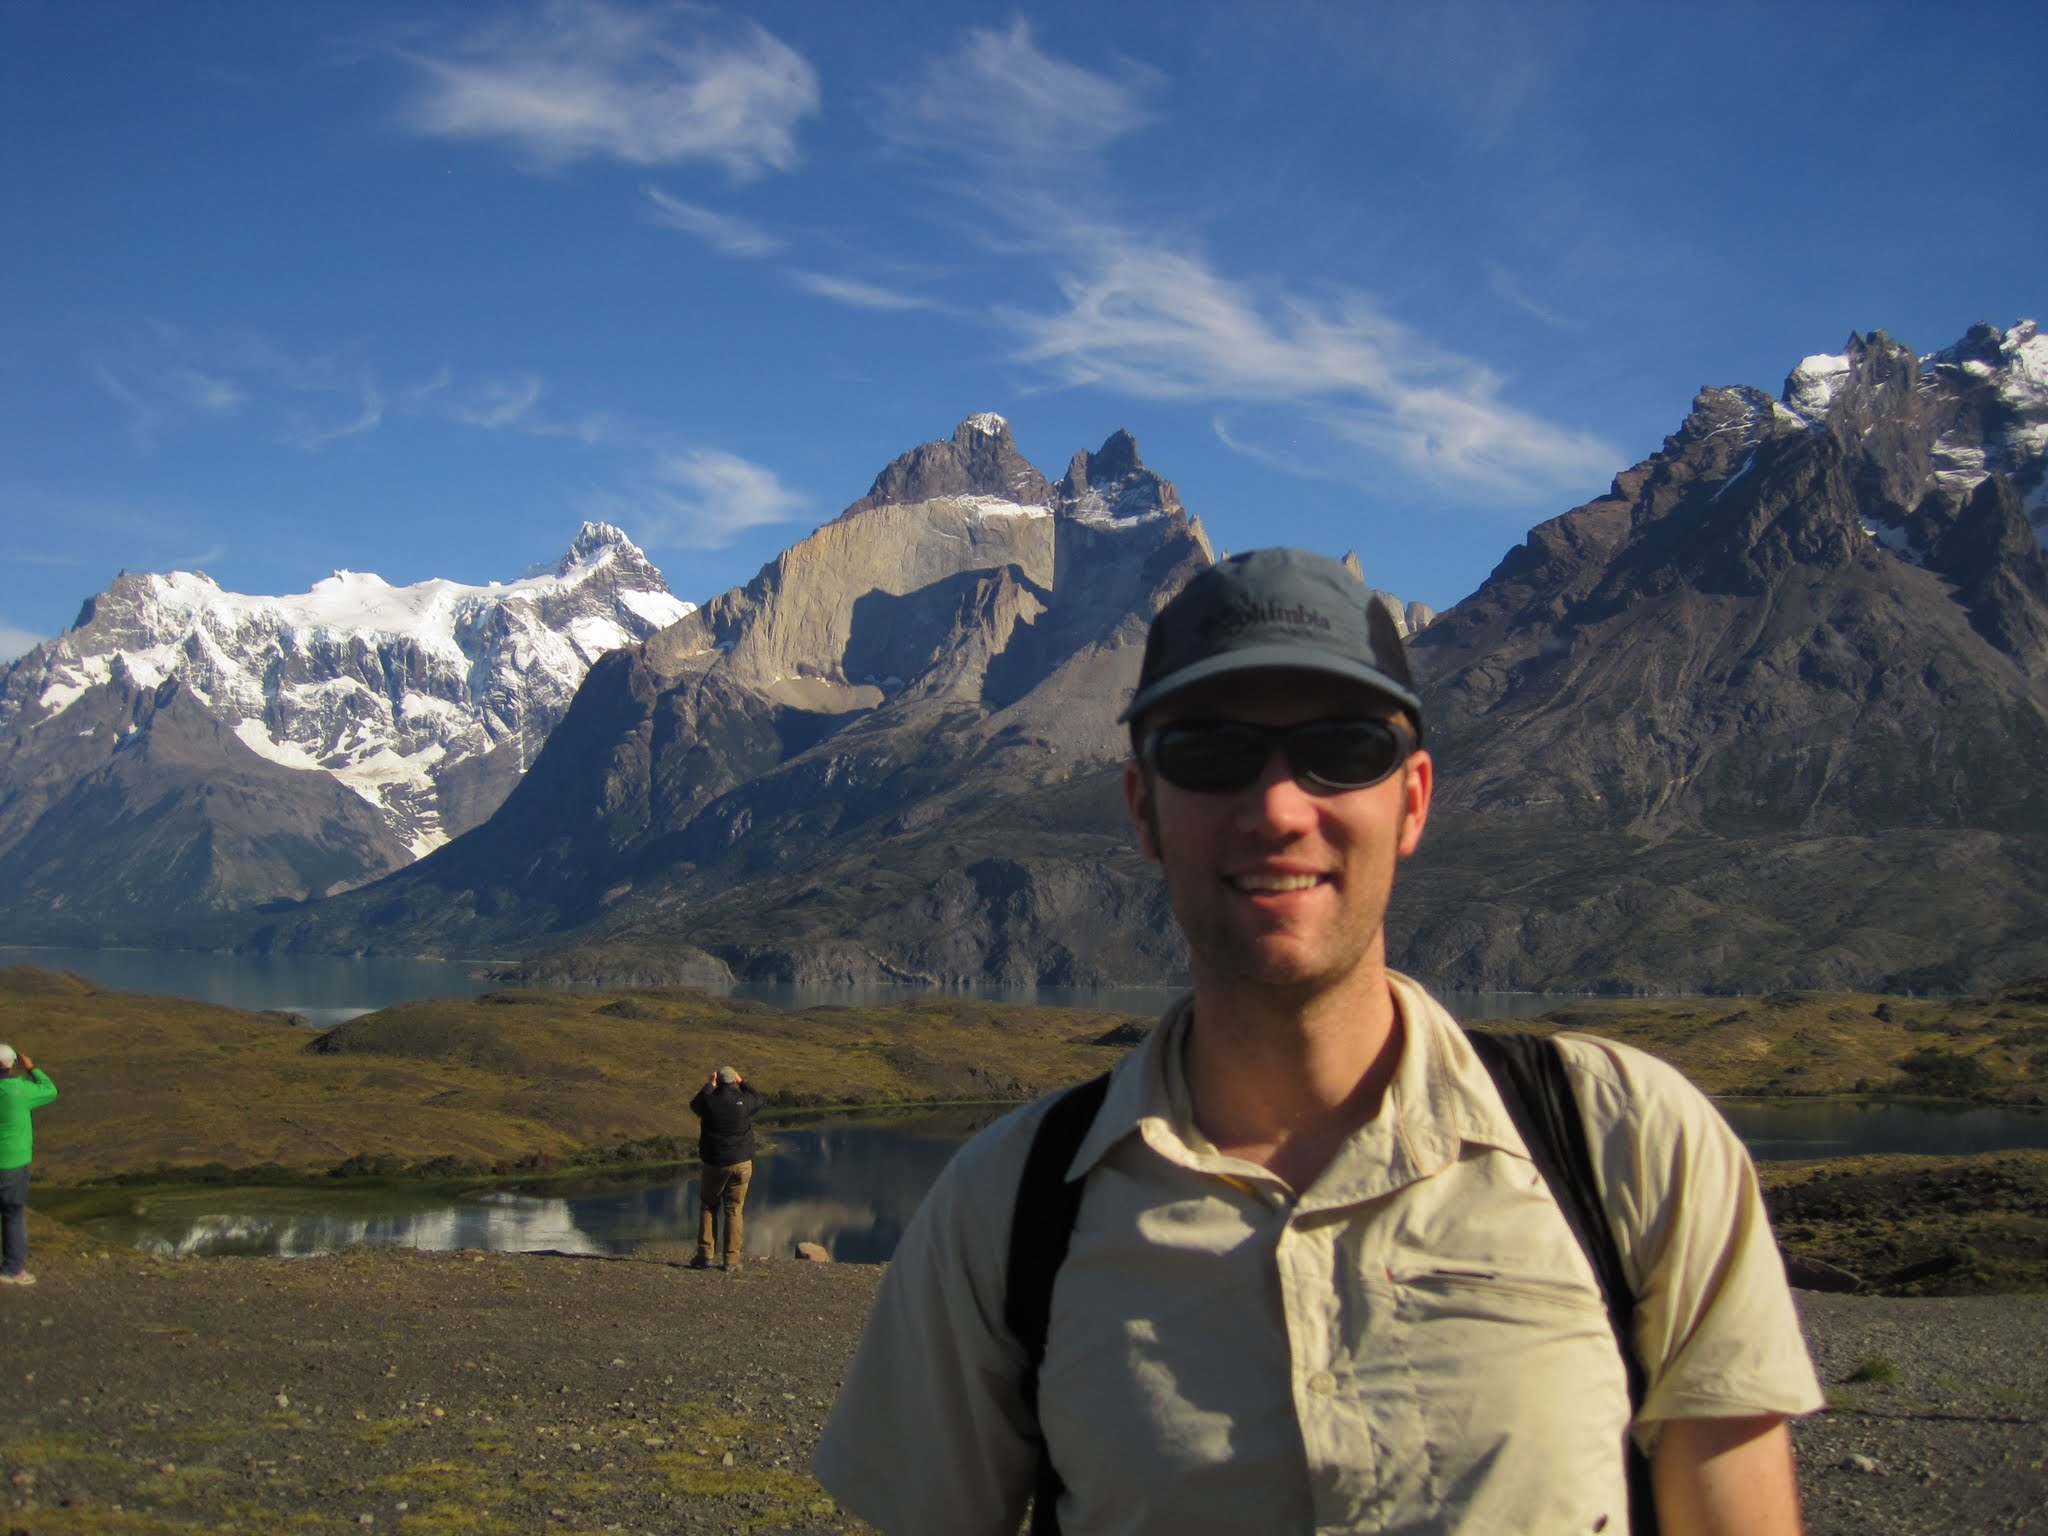
I have just returned from hiking the “W”, a famous circuit through the Torres del Paine, in Patagonia. Although I did some research before doing the trek, it turns out I made a number of assumptions that turned out to be incorrect. I will detail in this entry what I learned, a few things that worked well, and a few things that did not work so well.

I will try to avoid posting spoilers of the major sites, and instead focus on logistics of doing the trek. First things first: much of this content is from what I learned at a talk given at the Erratic Rock hostel, at 3PM the day before entering the park. The single biggest suggestion I would give you is to go to this talk.

Next, I should clear the two biggest assumptions I had before arriving, so you can plan accordingly.

  1. “Pirate” camping is frowned upon - probably even illegal in the park. You must stay at a designated camp-site.
  2. You can only cook at designated areas, which means you need to plan lunch meals that do not need to be cooked.
  3. Water from streams is apparently safe to drink. Nobody uses filters. Just fill up at a place with flowing water, which comes straight from glaciers, and not where there is a horse crossing.
  4. There are paid refugios and free refugios.
  5. The paid refugios (shelters) have showers.
  6. The transportation to and from the park is timed perfectly for all the trekkers, but it is crucial you plan for what bus you want to take.
  7. It gets really cold at night, at least it did in March. If you bring your own sleeping bag, then make sure it is rated at least down to -5C, maybe -10C, otherwise you won’t be getting much sleep.

How do you get to the Torres del Paine?

This naturally depends where you are coming from. I were in Santiago, so flew to Punta Arenas and took a bus to Puerto Nateles. One thing that was a little unclear was if the bus would stop at the airport in Punta Arenas or not. I decided not to risk it, so caught a mini-bus from the airport to the bus terminal (3000CLP), and caught a bus to Puerto Nateles almost immediately. It turns out the bus did stop at the airport and picked on person up - there were no other seats left. I would suggest you email or call the bus company (Bus Ferdnandez) and make sure they pick you up.

One of the first decisions you will need to make is if you should camp, or just stay in a refugio? It was obvious the people who were staying in refugios, as their packs were usually quite small, and they smelled really clean. It was obvious the people doing the full trek, as they usually looked tired, and not terribly clean. I were in the later group. Base Camp, right next to Erratic Rock, where the 3PM talk is held, offers gear rental. The prices are reasonable. Equipment needs to be reserved before you arrive during high season.

What are these refugios? Do they need to be booked in advance? The refugios are little shelters at different camp-sites strewn throughout the park. I camped, but I believe there are nice shelters (more similar to cabins), and some that are more like dormitories. Take note that you must camp at one of these designated campsites, and they aren’t all free - more details below in the day-to-day breakdown. The two companies running the refugios are: Fantasticosur and Vertice. I think you should book in advance, but maybe research this. 

What route to take? The route you take will depend strictly on how far you want to trek each day, or are capable, as you must stay at a camp-site. At the Erratic Rock talk they will give you a suggested route, from west to east, which is one I and a group of others followed. A map of the hiking area will be provided at check in.

The “Erratic Rock Route” goes like this:

Day 1

Catch 7:30 bus into Torres del Paine - your hostel/hotel can surely organise. Our bus cost 15000CLP return. You will enter park at about 10:00 and pay the park entrance fee. The fee is 18000CLP. You will also listen to a short talk telling you not to “pirate” camp, and don’t burn down the forest. The bus will wait for you. Continue taking the bus to the second stop, which is right next to Lago Pehoe. Disembark the bus and walk to the catamaran. The boat goes between this second stop and refugio Paine Grande. The boat costs 8000CLP.

You will arrive Paine Grande at about 13:00 and need to start hiking immediately. This day you will hike 11KM to Refugio Grey where you will set-up tent and put down your bags. The stay is 4000CLP. After setting down your bags you will keep going along the trail to the Mirador overlooking the glacier - this hike is about 4KM. Arrive as early as possible, as the sun will set behind the glacier and taking photos will become difficult.

Day 2

Wake up rather early, cook breakfast, and hike from Refugio Grey back to Refugio Paine Grande (11KM, ~3.5hr). Have a quick lunch, and continue hiking to Campamento Italiano (7.6KM, ~2.5hr). This is a free camp-site, so set-up tent, cook dinner, and get ready for bed. There is a water sprout near the top of the camp, so you don’t need to walk to the river for water.

Day 3

Wake up and hike the French Valley (7.5KM each way,  ~3hr each way). Return to camp, collect your gear, and walk to Los Cuernos (5.5KM, ~1.5hr). This stay is 8000CLP, but the showers were really hot. The camp-site fills up pretty early, as people are coming from both directions, so try to arrive earlier rather than later.

Day 4

Hike from Los Cuernos to Campamento Torres. About 9KM out of Los Cuernos you will encounter a big sign that says “SHORTCUT” - take it. This will take you around the backside of one mountain, by a lake, and cut some time off an already pretty long day. It is maybe 3.5hr from the shortcut to Campamento Torres, but it is all uphill. The trail gets very well used after merging with the trail from Los Torres hotel. Campamento Torres is a free camp-site. Consider camping uphill from the bathroom.

Day 5

Wake up quit early and depart for the Base de las Torres for sunrise. Most people leave Campamento Torres by about 6:15am, but when I went it was overcast, and the sun didn’t actually hit the mountain until almost 7:50. The walk takes about 45 minutes. Take your photos, hike back down to camp, pack up, and get back to Hotel Los Torres by 14:00. I ate breakfast at sunrise at the Base de las Torres (trail mix), but had a hot lunch at Campamento Chileno. A mini bus will pick you up by Hotel Los Torres at 14:00 and take you back to Laguna Amarga. This mini bus costs 2500CLP. Your bus will depart back to Puerto Natales at 14:30. Please shower and do laundry as soon as you get back - you probably smell like you’re homeless.

So, what are some things that worked really well for me?

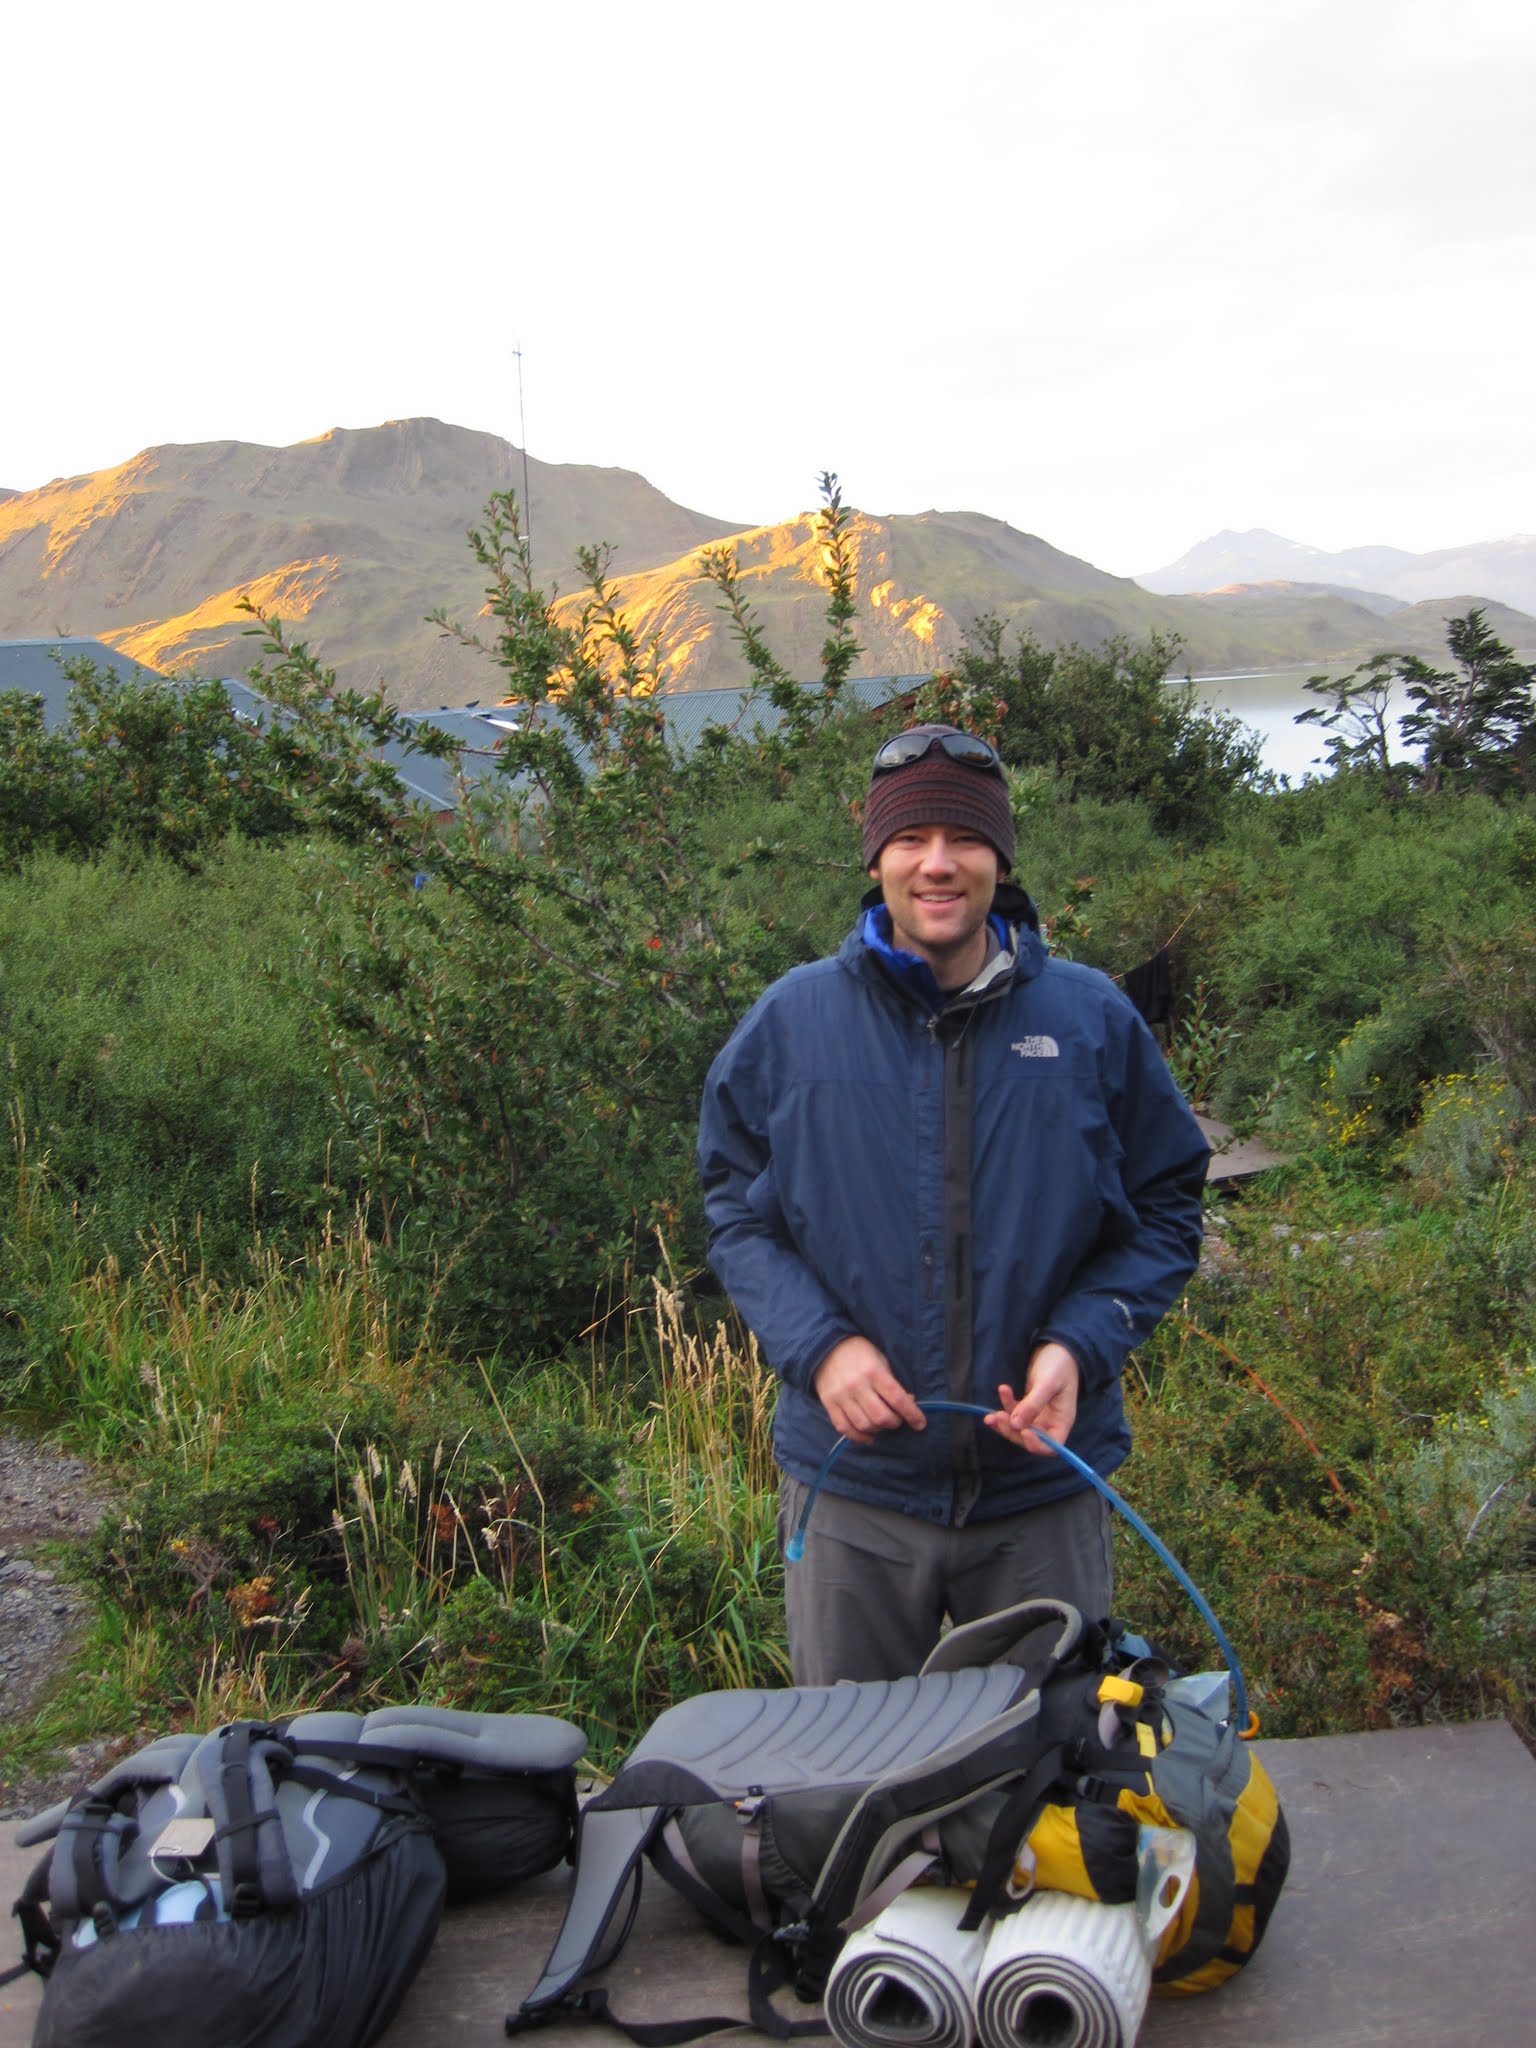
One of the best things I did was keep our packs light. Our packs were both under 10KG, including five days food, sleeping bags, pads, and tent. My pack was probably about 7KG. Probably the biggest regret I heard on the trail was that everyone’s pack was too heavy. I would say most were above 20KG, even for females. A lot of this was due to the food choices made. I read a book on ultralight hiking in university, so knew some basic rules for keeping pack weight down:

  1. Don’t buy food in tin cans or water (e.g. tuna)
  2. Don’t bring fresh fruits or vegetables
  3. Bring plastic or titanium/aluminum cutlery
  4. Don’t bring “it” if you won’t have to use “it” every day
  5. No knives or leatherman (you don’t have tins to open now…)
  6. 1x pants, 2x shirts, 2x socks, 2x underwear (or none), 1x long sleeve, 1x fleece, 1x down vest (maybe if cold), and 1x windbreaker/raincoat. That’s it. You don’t need three jumpers or five pairs of underwear. You probably don’t even need the shirts as a base.
  7. Put duct tape on random things (e.g. trekking poles) instead of bringing a roll of duct tape.
  8. Buy food that cooks quickly, not types of pasta that take 20 minutes. Risotto is pretty efficient (boil, heat it some, take off flame and cover), as are some thing types of pasta in soup.
  9. You can eat out of the bowls you are cooking in - you don’t need pots and plates.
  10. Bottles for only enough for 5 days. A full tube of toothpaste, big bottle of shampoo, and tube of sun screen all ads up the weight. The same is true for pills - you don’t need a full pack of multivitamins, five will do.

I heard stories of people cooking pancakes and french fries somehow, which would taste amazing, but I would rather eat risotto and have a pack 1/3 the weight. I both made it through with not a single blister, whereas the person next to me right now has seven.

Other suggestions of things that  worked well for me include:

  1. Wool or wool blends of everything. It dries fast, keeps you warm, and doesn’t keep odour. Get some wool blend underwear for travelling if you don’t already have some.
  2. Bring a super light day pack (like one of these) that you can toss water and food into for hikes that don’t require the full pack. If your full pack is comfortable enough, then just use that.
  3. Polarized UV protection glasses are a must, as is a hat. There were some seriously sun burned people returning from the trip, despite putting on “two layers of sunscreen”. Wear a hat.
  4. I brought my MSR “dragonfly” stove with me, and the normal cup to cook with. Erratic Rock / Base Camp have a container with half empty gas canisters. If you don’t mind risking running out of gas, grab one from here. Otherwise gas is about 8 bucks.
  5. Find additional people to share food with. Oatmeal is only sold by 1KG packages, which is a lot. Most people were throwing away leftover oatmeal at the end of the trip.

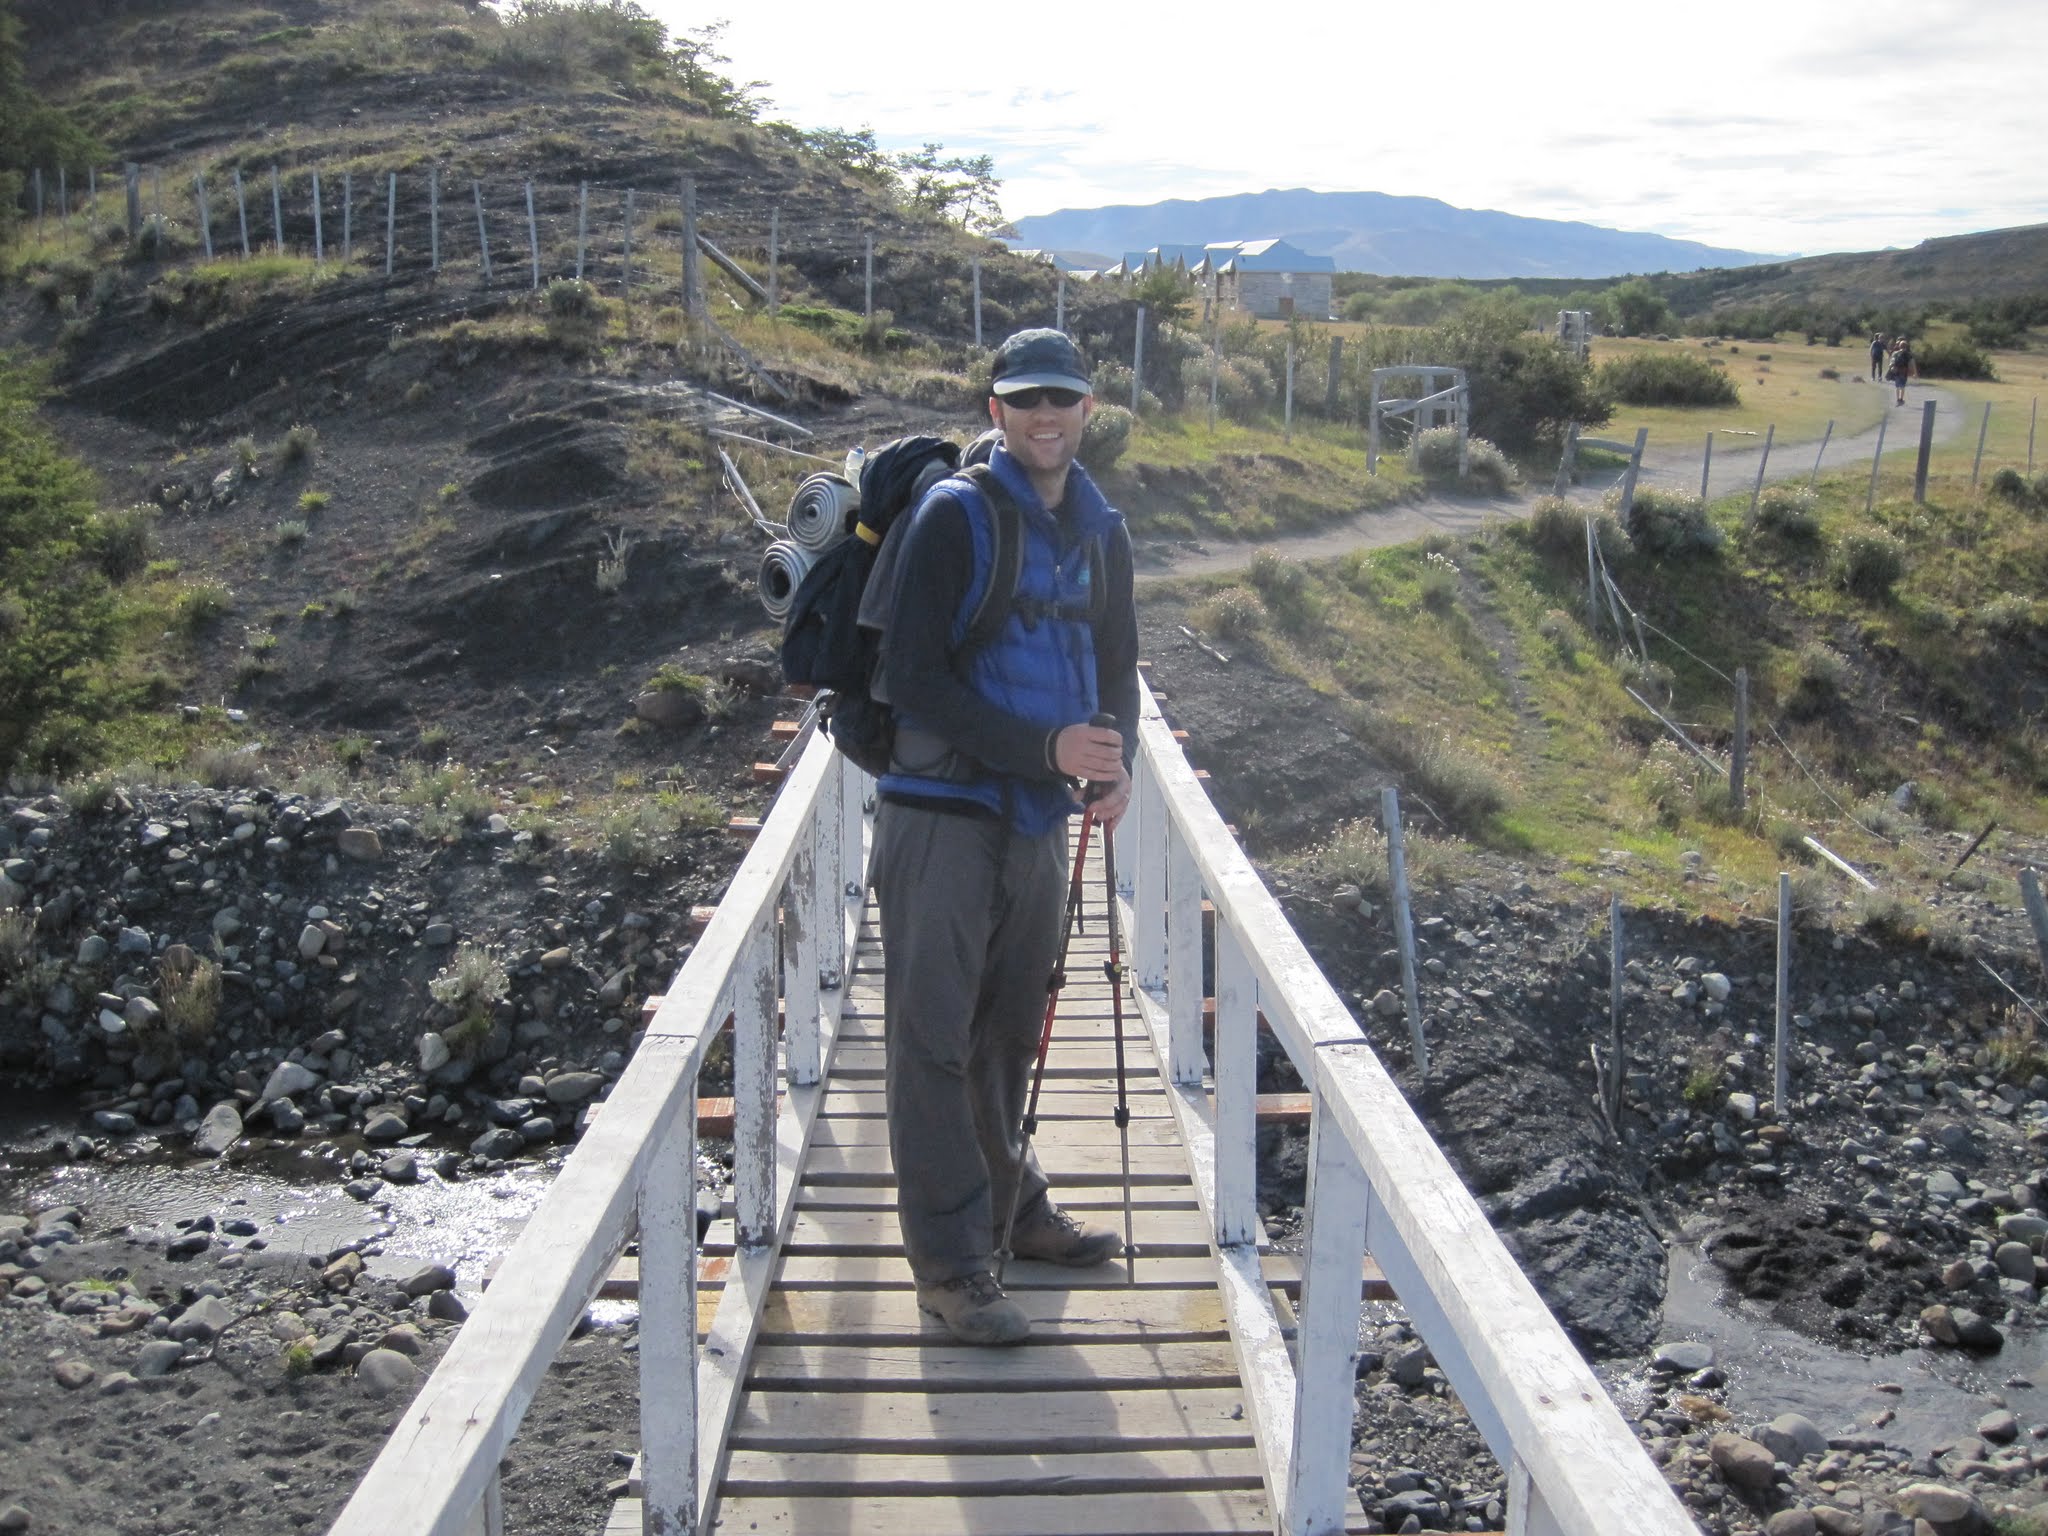
However, there were a few things that did not work that well, or not work as well as expected. The worst thing was a growing pain in my right knee. I’ve always had some pain in my knee after hiking, but by day two I was starting to have severe pain. The trails have quite steep ascends/descends. This destroyed my knee. On day four another walker who knew about my knee passed by and said “I have some trekking poles - I tried them, tripped over myself, and haven’t used them since. Wanna try?” I had never used poles before, thinking they were only for old people with bad knees… Needless to say, I’ll be buying a pair when I get back to Sydney, and I finished the day 4 hike without any pain. If you ever, even once, have had pain in your knees, then rent trekking poles. I had to skip the French Valley because my knees were hurting too much (I guess technically I hiked the “U”, not the “W”). If my pack was not so light, I do not think I would have been able to go up to the Torres.

The second mistake I made was not bringing a flashlight. My logic was I would just go to bed when it got dark, and rise when it got light. This is what I have always done before when trekking. Unfortunately, this does not work that well when you want to be up before the sun rises, e.g. to see the Base de las Torres. I followed (closely) some people with torches, so made it, but came close to tripping quite a few times, and it generally wasn’t that enjoyable. Most people had those LED lights that go on your forehead - that would be advisable.

Finally, I brought a Platypus for water. Hiking back in Oregon there would be some stretches with no water - maybe 4-5 hours of hiking without easy access to water. In the Torres del Paine, there was water nearly every two kilometers, so a Nalgene would have worked well. My better half just used her Nalgene, and it worked fine. It is also easier to fill up, and has measuring lines for how much water is needed for risotto.

That’s all the advice and information I can give about hiking the “W” in the Torres del Paine. The hike is a bit more expensive than I had expected, but there was some great camaraderie with other hikers, and it leaves you with a feeling of accomplishment when finished.

There are a few more sites that detail this trek, including:
How to hike the “W” in Torres del Paine
THE Definitive Guide to Hiking Torres del Paine

February Sydney Python Presentation

In February I gave a presentation to about 80 people at the Sydney Python group hosted by Atlassian. Firstly, Atlassian’s office was beautiful, feeling a little like Google’s Sydney office, but with beer on tap instead of cereal dispensers. Secondly, the talk before me on Cython by Aaron Defazio was exceptionally interesting, garnering lots of questions from the audience. My presentation, more of a show and tell on piping location data to Google’s Latitude through App Engine, was also meant to subtly share my views on the need for innovation in the public sector (all sectors, really).

My slides are below. I used very little text in the slides, but you can probably catch what is going on. The response from the audience was favourable, and I thank Dylan Jay for giving me the opportunity to speak.

Lessons Learned from Kathmandu

My first trip to Kathmandu is now over, so there are some lessons learned I should scribe. Some of these are obvious, and which I abide by whenever travelling, and some I simply forgot in my (very) impromptu trip to Nepal.

  • When agreeing on a price, make 100% sure the other person states the price back to you. I thought a price had been agreed to when the other person responded “ok ok, you are a lucky man”, but this does not count. As they say, reconfirm, reconfirm, reconfirm.
  • When arriving at the airport, make sure you have small bills, too. I had 3x 100RS, 1x 10RS, and then a few 500RS. The price I negotiated was 440RS, and it would have been nice to have paid the exact amount.
  • Kathmandu is polluted and dirty. I cannot emphasise this enough. It is dirtier than probably any other city I have been to. If I come back, I will be bringing masks. I know this sounds silly, to wear a mask, but any local on a motorbike or in a taxi wears a mask, and many just walking around. Instead of the normal cloth masks that many people use, I would probably bring a make with finer grained material - probably N95. I ultimately tried to avoid walking on main roads, but having some activated carbon absorb something would have made it a little less unpleasant.
  • Bring old cloths, and throw them away after the trip. Or just bring black. If you have nice jackets or clothing they will likely come back pretty dirty.
  • Bring some toilet paper. Similar to other parts of Asia, the bathrooms don’t have any.
  • Bring a flashlight. The load shedding makes the city dark, and if you go out, you will want a flashlight. There aren’t any lights. I only used it a few times, but I am really glad I brought two flashlights with us.
  • Bring vitamin C and lots of hand sanitizer. I did, like I always do when I travel, and I’m really glad I did. Everybody is coughing or sick, and everybody spits. It is similar to the situation in China, i.e. everyone spits. Then everybody gets sick. Bring hand sanitizer.
  • If you take a bus somewhere, try to ask when you buy tickets to sit on the left side in the middle. The front is a no-go for me. I typically had seats in the rear right, but on the curvy roads I think the left middle would be safer, as oncoming buses won’t hit you. One bus on the way back had the left side decimated. If you do a search on “nepal bus crashes” in images.google.com, you will quickly see why you don’t want to be in the front row.
  • My hotel rooms all typically had just one power outlet. If you bring multiple electronic devices, bring some way to  charge more than one at a time.
  • Bring clothing to stay warm at night. I travelled to Nepal in winter, and all my rooms got pretty cold at night.

Enjoy!